If you've looked at SRS early in the 2026-27 season, you may have noticed something odd. Fourteen games in, Boston is outscoring its opponents by 11.5 points a game, yet its SRS is only +7.5. On the other side, Utah is being outscored by 10.9 a game, and its SRS is -5.8. In other words, the schedule adjustment is taking four points away from one team and handing five to the other. For context, the gap between point differential and SRS across the league is bigger at this stage than in any season since 1994-95.
A big part of that is simple. East and West teams have met only 47 times so far, the West has won 33 of those games by an average of 7.3 points, and SRS has no choice but to apply that gap to every team in both conferences. That split accounts for about 40% of the spread in schedule strength this season, against about 10% in a normal year. (Vegas had the conferences about even in October, and the gap is already fading: a week ago SRS had the West 12.4 points better than the East, and now it's 6.4.)
Still, it finally got me to check something I've suspected for a few years – that early-season strength of schedule just isn't as useful as it used to be. Ten games in, a point of schedule strength used to be worth about 0.7 of a point of margin (SRS counts it as a full point). Since 2020 it has been worth roughly nothing. It was negative in four of the last seven seasons, and plain point differential beat SRS in five of the seven. Noisier games explain a small piece of that, and the versions of injuries, blowouts, home court, late-season changes and the NBA Cup that I tested don't explain the rest. Two seasons do most of the damage, and for different reasons: in 2020-21 the schedule number measured nothing, and in 2025-26 the schedule itself was stacked and a few teams' early shooting was far from their norm.
Note that SRS isn't 'broken'. By game 20 the adjustment works about as well as it ever did. Before then, I'd give it half weight and lean on a prior (more on both below).
The Test
For those unfamiliar, SRS is Doug Drinen's "Simple Rating System", which is what Basketball-Reference publishes for every team: a team's average margin, plus the average rating of the opponents it has played. So it's just margin plus schedule.
The question I'm asking here is a narrow one. After ten games, when we're trying to predict the rest of a team's season, how much is a point of 'schedule' worth compared with a point of margin? SRS says one for one. If the real answer is 0.7, then a schedule point is worth 70 cents on the dollar. If it's zero, you'd do just as well ignoring the schedule entirely. And if it's negative, the adjustment is actually pointing the wrong way – meaning teams that had played tough schedules went on to be worse than their margin suggested.
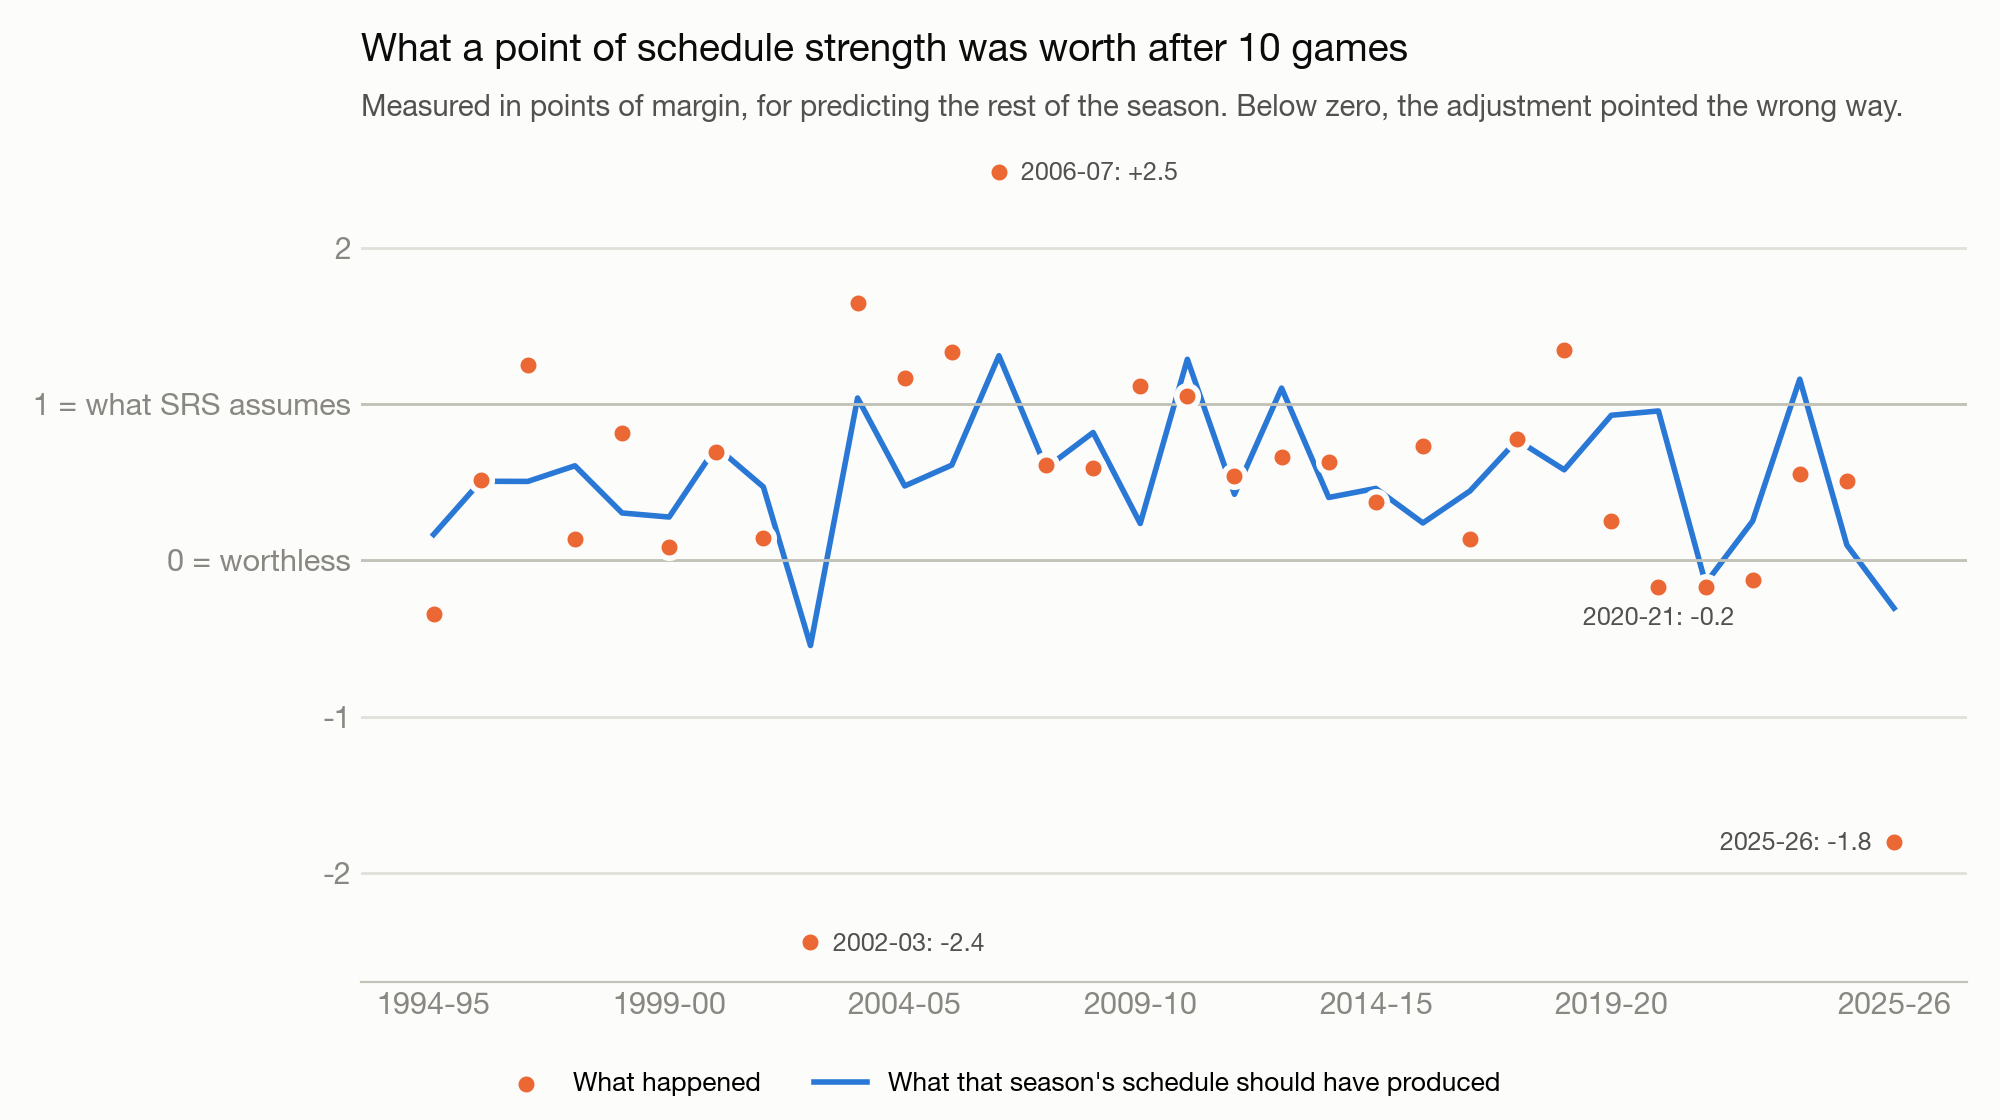
As you can see, through 2018-19 the answer was about 0.7, and it went negative only twice in 25 seasons. In the seven seasons since, it has been negative four times and has never reached 0.7. Last season's -1.8 is the second-worst on record (meaning the schedule adjustment wasn't just useless – it was pushing predictions almost twice as far in the wrong direction).
A simpler way to see the same thing is a straight head-to-head, with nothing padded or regressed. At a given point in the season, which of SRS and plain point differential did the better job of predicting the rest of each team's season?
| Games | Through 2018-19 | Since 2019-20 |
|---|---|---|
| 10 | 19 of 25 (+0.21) | 2 of 7 (-0.10) |
| 15 | 20 of 25 (+0.14) | 5 of 7 (+0.07) |
| 20 | 19 of 25 (+0.13) | 5 of 7 (+0.16) |
| 30 | 17 of 25 (+0.08) | 5 of 7 (+0.12) |
| 41 | 19 of 24 (+0.06) | 5 of 7 (+0.09) |
Seasons (from 1994-95) in which SRS predicted the rest of the season better than plain point differential, by games played. In parentheses is how much smaller SRS's typical miss on a team's rest-of-season rating was, in points, averaged over those seasons (negative means SRS did worse). The 41-game row has 24 earlier seasons because the lockout-shortened 1998-99 season is too short for it.
So at the ten-game mark, SRS used to beat plain point differential about three years in four, and since 2019-20 it has done it twice in seven. By game 15 or 20 it's ahead again.
Note that this compares the two ratings exactly as they stand. If we shrink both of them first (by an amount fit only on earlier seasons, which is what the padding further down does), all of these gaps get much smaller, and since 2019-20 SRS doesn't get back in front until about game 25.
One thing didn't change: a team's own point differential is just as predictive as it used to be. A point of early margin was worth 0.54 points over the rest of the season before 2020, and 0.55 since. It's only the opponent half of SRS that stopped working.
Noise and Luck
The first two suspects were noisier games and plain bad luck. NBA games really have become less predictable – the typical miss between a game's result and what team quality would predict has grown from about 11.5 points to 13.5, which makes every ten-game number shakier (opponents' numbers included). When I simulate the recent seasons with the old level of noise, though, the value of the adjustment only recovers by about 0.1, against a real drop of 0.4 to 0.7 depending on which seasons you count.
As for luck, a single season of this number is very noisy, so one bad year doesn't mean much. Seven years is harder to wave away. In every seven-season stretch from 1994-95 through 2018-19, SRS beat plain point differential at the ten-game mark in at least four of the seven seasons; in the last seven it has done it twice.
When the Schedule Makes the Adjustment Wrong
What reorganized the whole thing for me is realizing that what a schedule adjustment is worth depends on who happened to play whom.
Suppose the good teams happen to open against weak opponents, and the bad teams against strong ones. Now an easy schedule tells us two things at once. The first is that the team's margin is inflated, which is what SRS corrects for. The second is that the team is probably good, because in this particular year the good teams are the ones who got the easy schedules. Those two pull in opposite directions, and if the second is strong enough, the right weight on schedule is zero or below – even if we knew every opponent's true strength perfectly.
That's what 2025-26 looked like. Oklahoma City's first ten opponents turned out to be four points worse than average, while Brooklyn and Washington opened against tough slates. Across the league, the better a team turned out to be, the weaker its first ten opponents were, with a correlation of -0.62 – the most 'stacked' opening schedule in my 32 seasons. (The runner-up is 2002-03, which produced the single worst value on the chart.) In a year where good teams happen to draw easy early slates, seeing an easy slate is itself a clue you're looking at a good team, which fights directly against SRS's normal penalty for playing weak opponents.
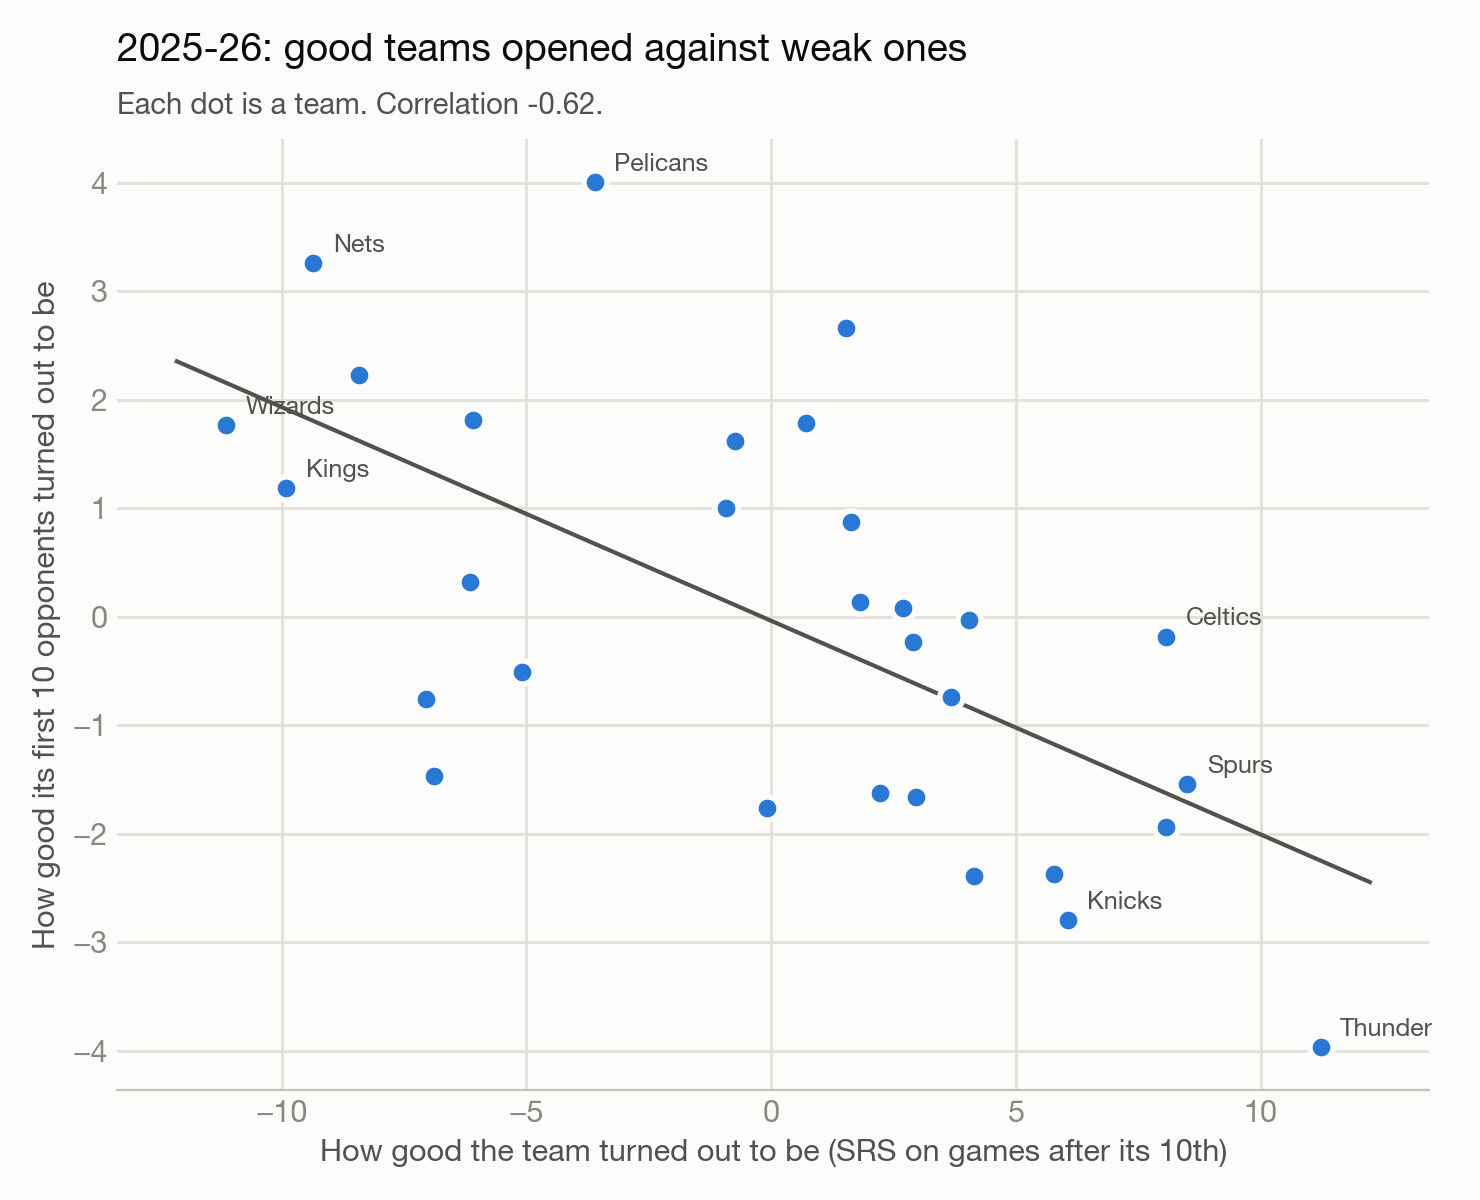
That holds across the whole sample too: the more an opening schedule was stacked this way, the less the adjustment was worth that year.
Was that just teams reacting to a hard start, with the ones buried early giving up later? Mostly not. If we rate teams by their preseason Vegas win totals instead of by how they turned out, the 2021-22, 2024-25 and 2025-26 openers were already tilted the same way before a game was played. (2025-26 was less extreme on that measure, so part of its tilt did appear during the season.)
Grading Each Season Against Its Own Schedule
Because a season with a stacked schedule should score low, the raw value isn't really a fair grade. To grade each season against its own draw, I replayed its real schedule 4,000 times with every team held at one steady strength and ordinary game-to-game randomness. The average of those replays is the value the adjustment 'should' have had that year given who played whom (the blue line in the first chart).
Before 2020, the real value averaged 0.64 (this is the average of the season-by-season values, so it's a little different from the 0.7 above, which pools all those seasons together), a touch above the 0.55 the replays predicted. Since 2020 it has averaged -0.14, against a predicted 0.42.
| Season | Actual | Predicted | Gap |
|---|---|---|---|
| 2019-20 | +0.26 | +0.93 | -0.67 |
| 2020-21 | -0.17 | +0.96 | -1.13 |
| 2021-22 | -0.17 | -0.15 | -0.02 |
| 2022-23 | -0.13 | +0.25 | -0.38 |
| 2023-24 | +0.55 | +1.16 | -0.61 |
| 2024-25 | +0.51 | +0.10 | +0.41 |
| 2025-26 | -1.80 | -0.31 | -1.49 |
Stacked schedules are part of the story – 2021-22 landed right where its stacked schedule predicted – but they aren't the whole story, since 2020-21 and 2023-24 had friendly schedules and came in low anyway. Five of the seven seasons fell short of what their own schedules predicted, and two of them (2020-21 and 2025-26) fell short by more than a point, which happened only once in the 25 seasons before that. Both of those outliers are worth unpacking on their own.
2020-21: The Schedule Number Measured Nothing
The COVID season started on December 22, and to cut down on travel the league had teams play each other twice in a row, baseball style. A quarter of all early games were part of one of those sets, so ten games covered about eight different opponents instead of the usual nine.
That alone shouldn't have sunk the adjustment – my replays know the schedule was thin, and they still expected +0.96. What stands out is that ten-game strength of schedule that year had essentially no relationship with how good those opponents turned out to be. The correlation was 0.02, where a normal season is somewhere between 0.4 and 0.8.
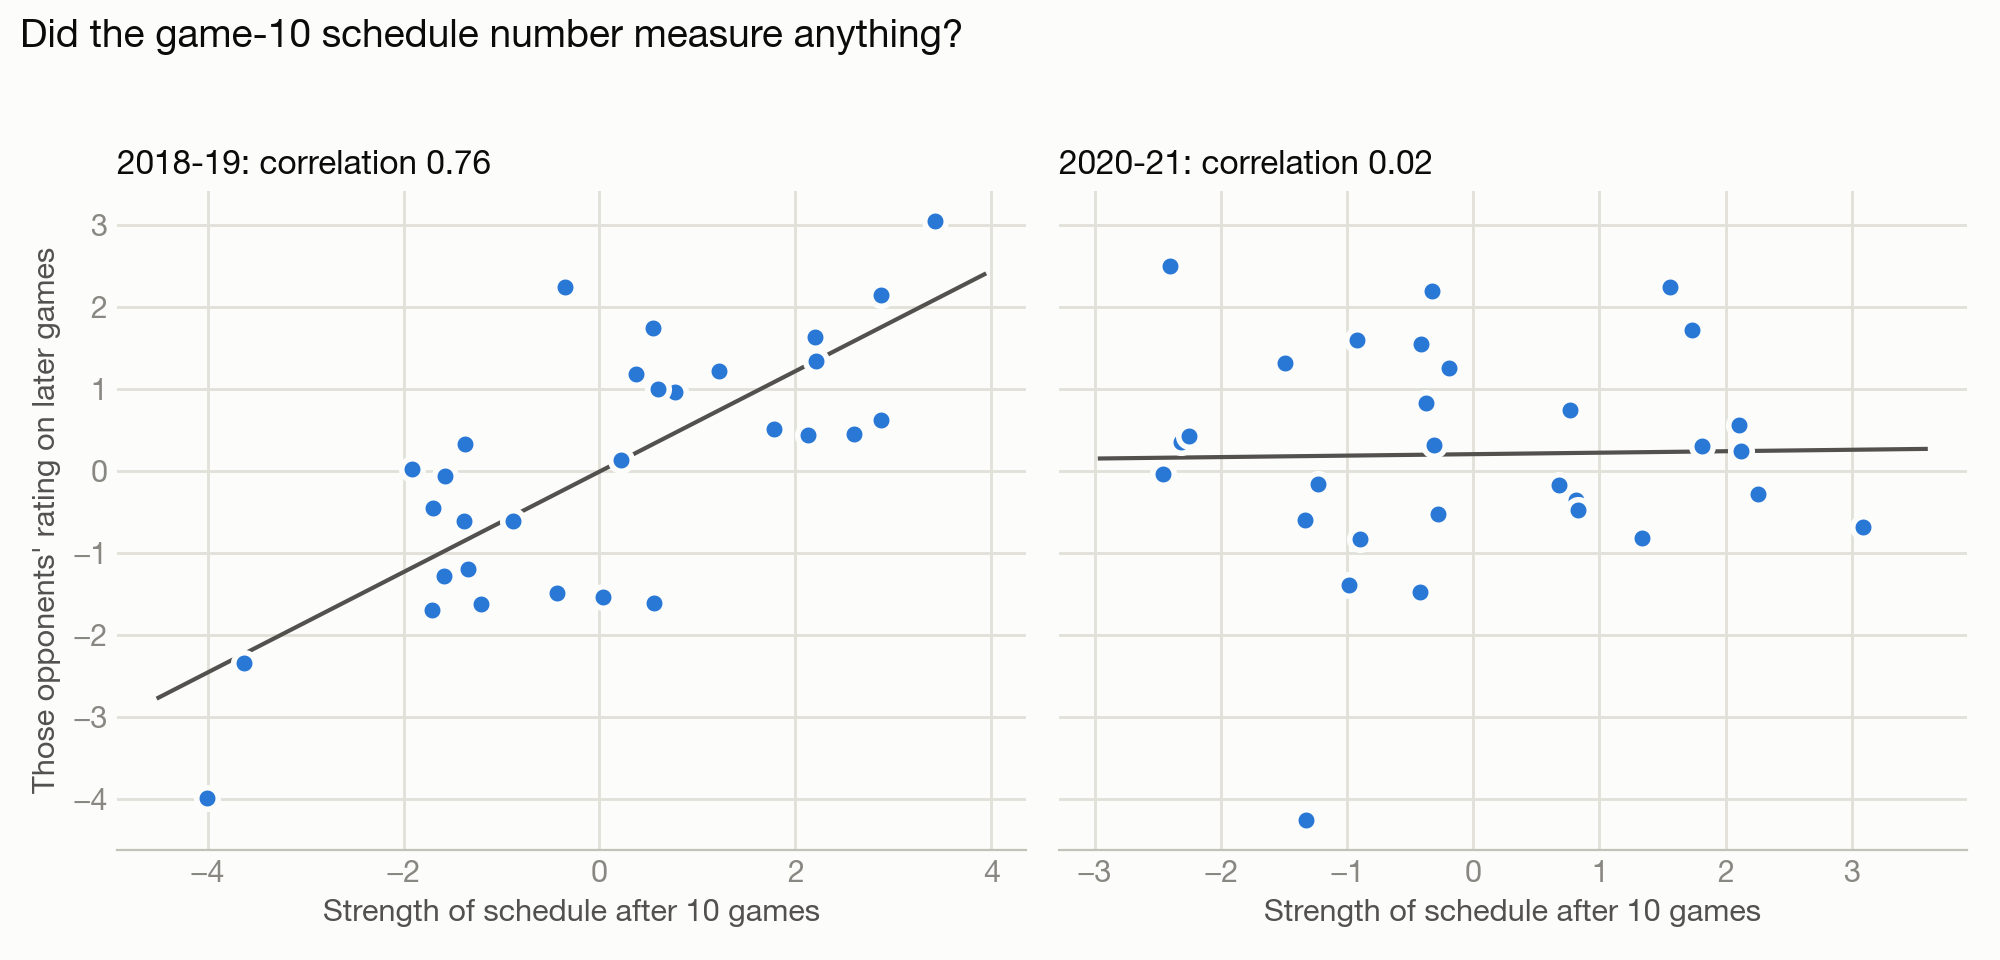
Five teams did most of that:
- Utah started 4-4, then won 20 of its next 21. It rated +0.4 early and +10.2 afterward.
- Houston traded James Harden and later lost 20 straight. It went from -0.1 to -8.4.
- Cleveland fell from -1.4 to -9.1.
- Minnesota, missing Karl-Anthony Towns early, climbed from -11.6 to -4.8.
- Indiana slid from +5.9 to -0.9.
With every team seeing only eight opponents, often twice each, those five misrated teams sat inside a lot of other teams' schedule numbers at once. If we swap in what just those five turned out to be, the correlation jumps from 0.02 to 0.49, and the value of the adjustment goes from -0.17 to +0.63. (Of course, I only took 2020-21 apart after seeing it was the outlier and picked those five teams because they were the most misrated, so this shows where the failure sat rather than proving what caused it.)
2025-26: A Stacked Schedule, Then Early Shooting
Last season failed in a different way. The schedule number was a perfectly fine measurement that year (its correlation with later opponent quality was a normal 0.65), but the opening schedule was the most stacked on record, and that alone drags the expected value down to about -0.3.
Part of the remaining fall to -1.80 looks like shooting. Chicago made 39.9% of its threes in its first ten games, against the 35.9% its shooters' track records implied. Boston made 32.2% against an expected 37.4%, and Oklahoma City 34.2% against 37.8%. Chicago looked like a +4 team after ten games and played like a -6 team afterward.
If we move every team's early margins halfway toward expected shooting, the value goes from -1.80 to -0.7; move them all the way and it's about zero. Note that this is a sensitivity check and not a clean measurement, since the adjustment can't tell luck from real changes in shot quality, and it's a 2025-26 story only – the same adjustment doesn't help the earlier seasons.
What Else I Checked
Given the 2026-27 East-West split, the obvious question is whether this is all just conference noise. It isn't. The East-West part of the schedule swings a lot from year to year and has made recent seasons look worse, but even with the conference gap taken out, the within-conference part of the schedule also fell from about 0.54 to 0.15.
I also checked injuries and rest, blowouts, home court, pace, late-season changes and the NBA Cup, and none of the versions I tested explains the whole decline. The pattern survives when I predict only each team's next ten games. Removing the Cup games helps a little in 2025-26 (the value goes from -1.80 to -1.14, against -1.46 for removing the same number of games at random), and doesn't help in 2023-24. These checks narrow the possibilities, though they don't prove those factors had no effect.
Two things stay open. Five of the last seven seasons came in under what their own schedules predicted, against a bit under half of the seasons before that. And three of the five most stacked opening schedules in 32 years were 2021-22, 2024-25 and 2025-26. I found no clear evidence that the Cup is behind that, and I'd rather leave both open than pick a story.
What to Do About It
Before game 20, I'd give the schedule half weight. Margin plus half of the opponents' average margin had the lowest error from 2019-20 through 2024-25, at 3.83 points, against 3.86 for margin alone and 3.90 for full SRS. (Note that I picked 'half' after looking at the data, so treat it as a rule of thumb.)
I'd also pad toward a prior – about 8 games of padding toward league average, or about 20 toward a preseason Vegas win total (the padding post explains how padding works). The Vegas version cuts early-season error by about 14%.
It's also worth checking the schedule itself. We don't know real team strength in November, but we do know preseason expectations, and by that measure the first 139 games of 2026-27 were an ordinary draw – much of the Boston and Utah gaps comes from an East-West split built on 47 games. And once teams hit the 20-game mark, SRS settles back into working about as well as it ever did.
For the technically inclined: the "value of a schedule point" is the ratio b/a from predicting each team's rest-of-season SRS as a × margin + b × SOS at its tenth game, weighted by games remaining. In the head-to-head table, each rating is scored as it stands against each team's rest-of-season SRS on the date of its 10th, 15th, 20th, 30th or 41st game, with the same weights. Note that the ten-game cutoff, the season groupings, and the 2020-21 / 2025-26 breakdowns were all chosen after looking at the data; 32 seasons isn't a huge sample, and the schedule replays assume every team has one steady true strength all year, so real midseason changes land in the 'unexplained' gap.