LeBron James was on Mind the Game this week saying he has never quite figured out why he can't become an 80% free-throw shooter, and Steve Nash offered him the usual list of suspects: the sudden stop in the flow of the game, fatigue, the awkward distance, and having an entire arena watching. Tangotiger picked it up and pointed out how big the gap between practice and games actually is – the odds of making a free throw in practice are roughly three times the odds in a game. In other words, a 90% shooter in practice (9:1 odds, making 9 for every 1 miss) is a 75% shooter in games (3:1, making 3 for every 1 miss).
That 3-to-1 figure came out of a back-and-forth Tango and I had back in 2020 over a photo of a practice whiteboard, so I wanted to lay out where the number actually comes from, and then see which of Nash's explanations show up in the game data.
The Lakers Board
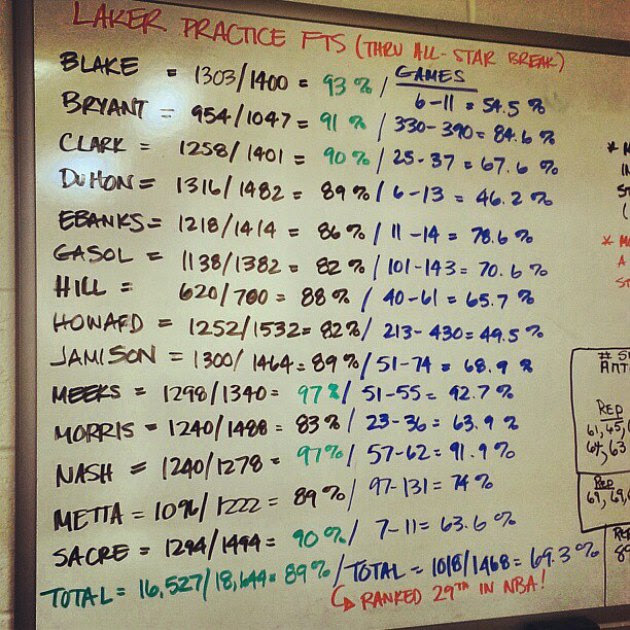
Back in March 2013, Beto Duran of ESPN Radio in Los Angeles posted a photo of a whiteboard from the Lakers' practice facility tracking every player's practice free throws through the All-Star break right next to their game numbers. It's still the best public dataset on this I know of, and it's where the classic 'Dwight Howard makes 80% in practice' factoid comes from. That one is completely true – Howard was 1,252 of 1,532 in practice (81.7%), against just 213 of 430 in games (49.5%).
Plotting the board against each player's game shooting gives the chart below:
Every Laker was better in practice
As a team, the Lakers had made 16,527 of 18,644 practice free throws (88.6%), versus 1,018 of 1,468 in games (69.3%). In odds terms, that's 7.8:1 in practice against 2.3:1 in games – about 3.5 times as high. Of course, several of these guys had barely taken a dozen game free throws by the All-Star break, so I prefer comparing each player's practice rate against their DARKO projection at the time. That puts the same group at about 72% in games, and puts practice odds at roughly 3 times game odds (with Steve Nash making 97% in practice).
As you can see, it isn't the same for everyone – Pau Gasol and Kobe Bryant lost the least (their practice odds were roughly twice their game odds), while Howard lost the most at 4.6 times – but nobody on the roster was remotely as good in games as they were in practice.
(I went looking for other team practice boards like this one and came up empty. If you know of any, I'd love to see them.)
What Could Explain It?
So what's actually driving that gap? Between Nash's list and the replies to Tango's tweet, the candidates boil down to four things: fatigue, rhythm (in practice you shoot a bunch in a row), the crowd, and pressure. (The distance is the same in practice, so we can cross that one off.) We don't have more practice data, unfortunately, but we do have every NBA game free throw from 1996-97 through 2024-25 – about 1.76 million of them – and each theory predicts something we can test within games. If fatigue is a major factor, for instance, players should shoot noticeably worse late in quarters and deep into their minutes.
For all of these tests, I'm comparing each player to themselves in the same season, since who ends up at the line in any given spot isn't random (teams intentionally foul bad shooters late, and the best shooter on the floor takes the technical).
Rhythm
Let's start with the explanation that shows up most clearly in the data. On two-shot fouls, players make 73.5% of the first shot and 78.1% of the second, and comparing each player to themselves the gap is 4.6 percentage points. (Kyler Kelton estimated this at around 5% in the replies to Tango, which is basically dead on.)
Three-shot fouls let us go one step further – the second shot is 5.0 points better than the first, and the third is 6.0 points better. Most of the gain arrives right away on shot two, though it's still ticking up a bit on shot three, and that's about as far as NBA games let us see (almost nobody shoots four straight free throws at one whistle).
The second free throw is the jump, and the third adds a little more
LeBron himself is a great example of how much this matters. For his career (through 2024-25), he's a 74% free-throw shooter overall – which feels a long way from 80% – but that's 71.1% on the first of two and 77.2% on the second. He has actually shot 80% or better on his second shots in 6 of his 22 seasons, and on his first shots in none of them.
How long does that warm-up last? The play-by-play logs the time of day for each event (reliably through 2018-19), so we can track the first shot of a trip by how many real minutes have passed since that player's previous free throw. You can see the decay curve below: within a minute or so, players shoot 4.2 points better than on their first trip of the game, which is close to what the second shot gains over the first. After 5 to 9 minutes that edge fades to 2.5 points, after 10 to 19 minutes it's down to 1.7, and after 40 minutes or more (roughly the other side of halftime) only 0.6 points remain.
One free throw warms you up, and it wears off in about half an hour
There's a broader version of this 'warming up' effect too. A player's very first free throw of the game goes in 72% of the time, and the first shot of their later trips is about 2 points better than that. Coming off the bench cold hurts as well – a player who checked in within the last two minutes shoots about 2.1 points worse on first shots than once they've been on the floor a while, and even players who stayed in the game are about 0.8 points worse during the first two minutes after a quarter break. Technical free throws (one shot, cold, usually by the team's best shooter) are no better than that player's ordinary first shots.
Does any of this carry over from one game to the next – say, are you better off coming out of a game where you took 10 free throws than one where you took 2? At first glance, it looks like yes: a player's first free throw of the night is about 1 point better for every 10 free throws they shot in their previous game. The catch is that it's also about 1 point better for every 10 free throws they take in their next game, which obviously can't be warming anybody up. Players simply shoot a bit better during stretches of a season when they're getting to the line a lot, and once you account for that there's nothing left over for the previous game. Whatever a free throw buys you is completely gone by the next night.
Two other details about the second-shot bump are worth pointing out. First, it hasn't budged over time – it has landed between 4.0 and 5.3 points in every single one of these 29 seasons, even as league free-throw shooting climbed from 74% to 78%, meaning first shots and second shots improved by the exact same amount. Second, it's roughly the same size for bad shooters and great ones (between 3.5 and 5 points at every tier from sub-60% shooters up to 85%+ shooters), so it behaves much more like a fixed number of percentage points than a fixed multiple of odds.
I don't know exactly how the Lakers ran their practice free throws, but if you're shooting in sets of 10, nine out of every ten attempts are 'second shots'.
Everything Else
With rhythm out of the way, here is every other explanation I tested, showing how much better or worse players shoot in each situation compared with their own baseline that season:
| Explanation | Situation | Difference (percentage points) | Free throws |
|---|---|---|---|
| Fatigue | Last 4 minutes of a quarter vs. first 4 | +0.4, +0.8, 0.0, −0.2 (Q1 to Q4) | 760,000 |
| Fatigue | 30+ minutes already played | −0.1 | 265,000 |
| Fatigue | Second night of a back-to-back | +0.3 | 355,000 |
| Fatigue | Overtime vs. fourth quarter | −0.9 | 17,000 |
| Out of breath | Fouled in transition | −0.1 | 116,000 |
| Out of breath | And-one after a dunk | −0.3 | 10,000 |
| Out of breath | Fouled in the bonus (no shot) vs. fouled shooting | 0.0 | 151,000 |
| Crowd | Road vs. home | −0.2 | 832,000 |
| Crowd | Visitors in Denver vs. their other road games | −0.7 | 29,000 |
| Crowd | Visitors in Utah | +0.1 | 30,000 |
| Crowd | 2020 bubble (no fans) vs. earlier that season | +0.8 | 8,000 |
| Low stakes | Preseason vs. the regular season that follows | −1.0 | 16,000 |
| Pressure | Last 5 minutes, within 5 | −1.1 | 123,000 |
| Pressure | Last 30 seconds, within 3 | −1.9 | 27,000 |
| Pressure | Last 10 seconds, within 1 | −3.1 | 3,800 |
| Pressure | Playoffs | −0.8 | 113,000 |
| Pressure | Finals | −1.7 | 6,300 |
| Pressure | Game 7s | +0.2 | 3,300 |
| Score | Trailing vs. leading | −0.1 | 781,000 |
| Time off | Opening night (after a full preseason) | −2.6 | 21,000 |
| Time off | First game back after missing 5+ team games | −3.3 | 12,000 |
| Time off | 5-9 days off without missing a game (mostly the All-Star break) | −0.3 | 30,000 |
As you can see, most of these effects are pretty small. A few of the bigger ones – and a couple of the more surprising non-results – are worth unpacking.
Pressure is definitely 'real', scaling cleanly from ordinary clutch time down to the final seconds of a one-point game. It hurts more when trailing (about 3 percentage points in the last 30 seconds) than when leading (about 1.7), and it hits shaky shooters harder than great ones – sub-75% shooters lose about 3.5 percentage points in the last 30 seconds, compared with about 1 for 82%+ shooters. (I'm excluding the free throws teams miss on purpose at the very end, e.g., trailing by two or three, or up one with a second left.) And there's no 'rubber band' effect hiding in here either – outside the last minute, trailing teams and leading teams shoot the same.
Fatigue, on the other hand, mostly doesn't show up. Tango suggested the simplest check – comparing the start, middle, and end of each quarter – and players actually shoot the same or slightly better late in quarters. Guys past 30 minutes played shoot about the same as they do earlier, and only about 0.4 percentage points worse once you account for them being warmed up by then. Back-to-backs and being out of breath after a fast break or an and-one dunk look just like any other free throw.
The crowd is worth about a quarter of a percentage point (home versus road), and it has sat right there in every era. The 2020 bubble, with no fans at all, was a bit higher than the same players had shot earlier that season – ordinary seasons don't show a late rise like that on average, though year-to-year noise bounces around by roughly that much.
I also checked whether specific buildings are harder to shoot in, and they are, slightly. After padding, the toughest ones cost visitors about a third to half a percentage point, with Denver and Lakers home games sitting at that end. Across the league, though, whatever is going on hits the home team's shooters just as much as visitors, so it looks like the building itself (the backdrop, the rims, or in Denver's case presumably the altitude) rather than the fans. (The Lakers are the one oddball here – visitors shoot worse at Lakers home games, while the Lakers themselves don't, and visitors against the Clippers in the exact same building lose less than half as much, so I wouldn't read too much into that one.)
Preseason is the result I find most interesting. If the practice-to-game gap were mainly about stakes, then exhibition games in half-empty arenas in early October ought to look a lot closer to practice. Instead, the exact same players shoot slightly worse in preseason than in the regular season that follows.
Related, and even stranger, is opening night, where players drop off noticeably even with a full preseason behind them. It hits hardest on the first free throw of the night (about 4 percentage points), lasts all game, and doesn't really go away until around game four. You can reasonably chalk up the dip after missing five or more team games to rust or whatever kept a player out; for opening night, honestly, I don't have a great explanation.
Icing and the Free Chicken
Two specific versions of these stories are worth testing directly. The first is 'icing' the shooter, where the defense calls timeout before a free throw. On the first shot of a trip, it does next to nothing – players shoot 0.3 points worse after a defensive timeout than without one (29,000 trips), and roughly the same after their own team's timeout. (Most of these are just ordinary timeouts that happen to follow a foul; there are only about 340 defensive timeouts before a late-and-close free throw in the data, which isn't nearly enough to say much, though those shooters did fine.) A replay review is a bigger deal, costing about 1.6 points on the first shot afterward (7,900 trips), and players shoot about 1.8 points worse on flagrant fouls, which usually come with both a review and a harder hit.
A timeout between the two shots is a different story. Those are rare (about 5,000 in 29 seasons, almost all called by the defense), and the second shot after one drops by about 2.3 points – wiping out roughly half of the second-shot bump. Tellingly, the 400 or so called by the shooter's own team cost even more (about 4.5 points, albeit on a small sample), and any other delay of two minutes or more between shots costs about 2.4 points. So this looks a lot more like the interruption breaking your rhythm than mind games from the opposing bench. Even a normal substitution between shots, which happens on nearly a third of trips, costs about 0.6 points – fitting right in with the warm-up curve above, where whatever the first shot buys you starts fading almost right away.
The second story is the one LeBron brought up on the podcast: fans winning free chicken when a visiting player misses two in a row late in the game. If the crowd moves the needle anywhere, you'd expect it to show up on a visitor's second shot in the fourth quarter after missing the first. Visitors make 73.4% of those (30,000 shots), while home players in the exact same spot make 73.6%. Note that second shots after a miss are about 2 points worse than second shots after a make for everybody – home and road, in every quarter – so that part isn't the crowd. What we're actually looking for is an extra penalty for being the visitor in the fourth quarter, and that comes out somewhere between zero and half a point. It hasn't grown as these promotions spread in the 2010s either.
The G League
The G League gives us an even cleaner test of rhythm than anything in the NBA data. Since 2019-20, a foul there awards just one free throw worth all the points – a single shot worth two on a normal shooting foul, or three if you were fouled on a three (ordinary free throws come back for the last two minutes of the fourth quarter and overtime). So almost every G League free throw is now a 'first shot', with no second one coming.
Before the rule change, the G League looked just like the NBA, with players shooting 5.2 percentage points better on the second of two than on the first. If that bump really is about rhythm, then switching to one free throw should make those shots go in like first shots, not like the average of the two – and that's pretty much exactly what happened. Leaving out the last two minutes and overtime, G League players made 71.8% of their first shots in 2018-19 and 71.3% of their single free throws in 2019-20, the first year of the rule. Overall, league free-throw shooting dropped from 74.6% to 72.2% overnight (it has crept back up since, to 74.3% in 2025-26, right alongside the NBA's own upward trend).
You see the exact same pattern player by player, as shown in the chart below. The 193 players with free throws in both seasons made their 2019-20 single free throws at essentially the same rate as their own 2018-19 first shots (0.3 percentage points worse), and 6.3 percentage points less often than their second shots. The same split holds within each season since the rule came in too: players make their single free throws about as often as the first of two in the last two minutes (0.3 percentage points better), and 3.7 percentage points less often than the second.
The single free throw goes in like a first shot
You might expect these single free throws to be harder simply because there are more points riding on one shot, but there isn't much sign of that. The cleanest comparison is the three-point version against the two-point version (the one-point version is mostly and-ones, which are a different kind of trip), and players make the three-point shot at roughly the same rate – 0.3 percentage points worse, across about 3,200 attempts.
There is one other surprise buried in the G League data. Plenty of players shoot free throws in both leagues in the same season, and before the rule change (so apples-to-apples, two shots in both places) they were 4.7 percentage points better on first shots in the G League than in the NBA, and 2.5 percentage points better on second shots. A lot of that is probably role and usage – in the NBA, about 70% of these players' trips to the line are their very first of the game, versus roughly 40% in the G League, and on later trips the first-shot gap drops to about 2 percentage points. The gap is also much bigger for call-ups who barely played in the NBA that season than for guys with a real rotation role. The samples get small fast here, so I wouldn't lean on the exact number too hard, though something still seems to be left over either way.
Adding It Up
So how much of the practice gap does all of this actually explain? The average free throw in my data goes in 75.8% of the time. If practice odds are three times game odds, that corresponds to a shooter who makes about 90% in practice, leaving roughly 15 percentage points to explain. Putting all of the factors above into one joint model, the best conditions you can find inside a game – the third shot of a trip, at home, warmed up, not late and close – get that shooter to about 80.6%. That's roughly a third of the gap in percentage points, or a quarter of it in odds terms (since moving from 80% to 90% is a much bigger jump in odds than 75% to 80%), and nearly all of it comes from rhythm. (And third shots are rare; the second of two in those same conditions gets you to about 79%.)
Here's how all of those situations stack up next to the practice gap. Note that a few of the numbers below shift slightly from the table above because everything is estimated simultaneously – for example, the overtime penalty gets cut roughly in half once late-game pressure is accounted for. There's also one row I didn't cover above: a player who gets back to the line within 30 seconds of game time (say, fouled intentionally on back-to-back possessions) shoots about 2.3 points better on the first shot, which is just the warm-up curve showing up again. And the first two minutes of the game cost roughly as much as the first two minutes of any other quarter.
Everything inside a game is small next to practice
As you can see, that still leaves most of the practice gap unexplained by anything we can observe inside games. I don't think that means Nash is wrong about the rest of his list, though. Every free throw in this dataset – even a garbage-time attempt in January – is still taken in a real game, in front of people, right after a stop in play, so comparing games to other games can't tell us what being in a game costs on its own. What it can tell us is that the cost doesn't move around much: home or road, fresh or tired, preseason or the Finals, players shoot within a few points of their usual level, and nowhere near what they shoot in an empty gym.
Is Any of This a Skill?
One last question worth checking is whether some players are genuinely 'chokers' or slow starters in a way you could actually project going forward. For the most part, the answer is no. Using the padding approach, a player's first-shot penalty needs about 2,400 two-shot trips before it's even half 'real' (for context, LeBron has about 5,900 in this entire dataset), and it barely carries over from one season to the next. A late-game clutch penalty needs around 1,000 clutch free throws, and only 80 players in this data have even reached 300. So when a player shoots 60% in the clutch one season, the best guess for next year is still just their normal free-throw percentage, minus the point or two everybody loses.
Which brings us back to LeBron. Getting into rhythm at the line explains a real chunk of why game shooting lags practice – and it's why LeBron shoots like an 80% guy on second shots in his better seasons – but most of the 3-to-1 practice gap is simply the baseline cost of stepping up to the line in an NBA game, and it hits basically everyone in the league the same way.
How the numbers are calculated: free throws from the NBA's play-by-play for 1996-97 through 2024-25, regular season and playoffs, plus preseason games from 2020-21 through 2024-25, and G League play-by-play from 2015-16 through November 2026. Each comparison is made within a player's season (and within the same shot of the trip, except where the shot number is the thing being compared) and then averaged across players. The one exception is the G League rule change, which compares each player across the two seasons. The numbers in Adding It Up come from one linear model of makes and misses with all of the situations in it at once and a separate baseline for each player's season, so each effect is measured against a free throw with none of the other conditions. Time on the floor is reconstructed from substitutions. The Lakers numbers are read off the practice board photographed in March 2013.